
How Hardiness Zones Work and Why They Matter When Choosing Plants

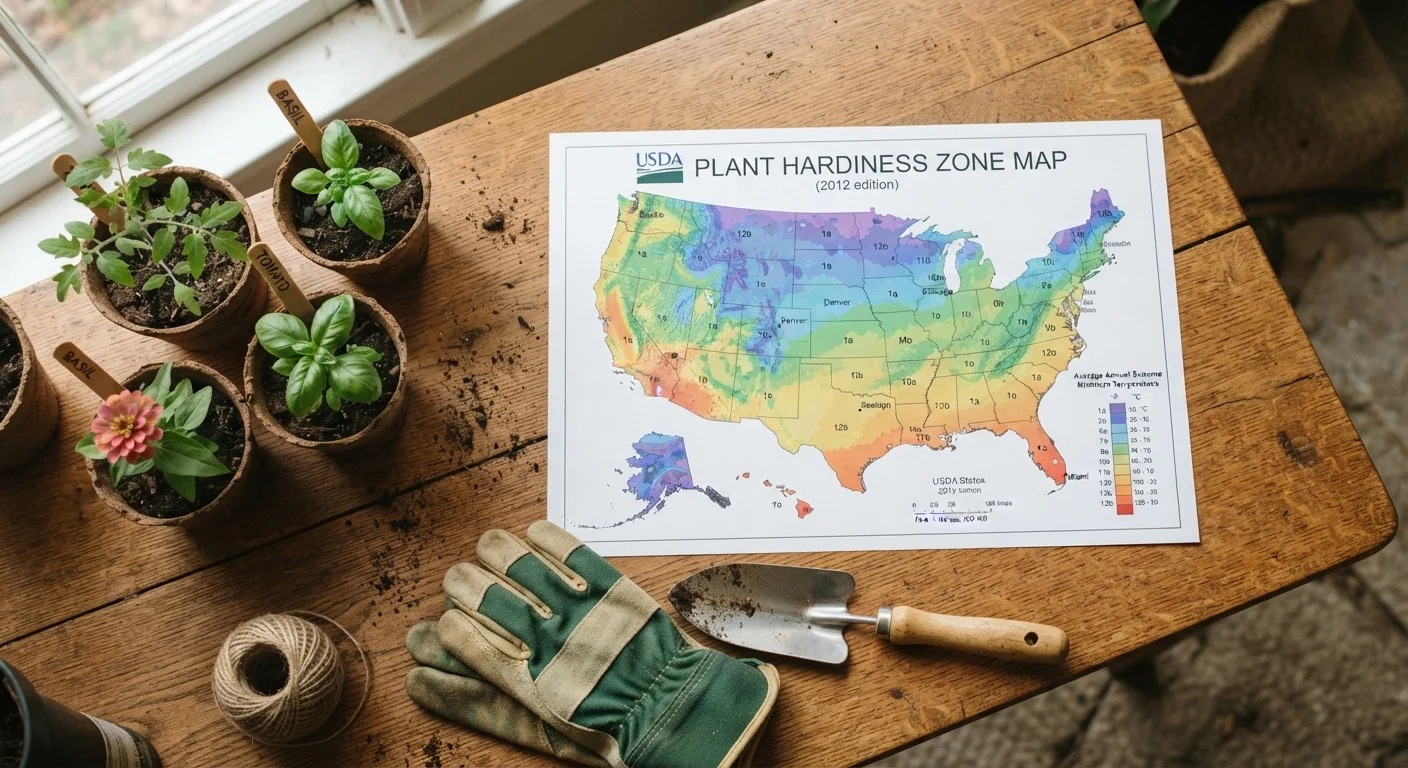
Photo: InsightsTurbo.com | Kickstart Your Knowledge Quest editorial
Key Takeaways
- Hardiness zones are based on average minimum winter temperatures, not overall climate.
- The USDA Plant Hardiness Zone Map divides the US into 13 zones, each split into 'a' and 'b' sub-zones.
- You can look up your zone by ZIP code on the USDA website for free.
- Zone ratings on plant labels indicate the coldest zone a plant can reliably survive.
- Zones are a starting point - local factors like wind, moisture, and microclimates also affect plant survival.
What a Hardiness Zone Actually Measures
When you pick up a plant at a nursery, the tag often lists something like "Zones 5-8." That shorthand refers to the USDA Plant Hardiness Zone system, which maps the entire United States into 13 numbered zones based on one specific measurement: the average annual extreme minimum temperature - in plain terms, the coldest it typically gets during winter.
Zone 1 is the coldest (think interior Alaska, with lows below -50°F), and Zone 13 is the warmest (parts of Hawaii and Puerto Rico, where winters barely cool at all). Most of the contiguous US falls between Zones 3 and 10. Each zone is further divided into "a" and "b" sub-zones, each covering a 5°F range, giving you an even more precise picture of your local cold.
It's worth noting what zones don't measure: they say nothing about summer heat, rainfall, humidity, or soil conditions. A Zone 8 garden in coastal Oregon and a Zone 8 garden in Dallas experience very different climates - they just share a similar winter low. Zones are one important tool, not the whole story.
Zones Reflect Cold, Not Heat
How to Look Up Your Zone
Finding your zone takes about thirty seconds. The USDA maintains an interactive map at planthardiness.ars.usda.gov where you can type in your ZIP code and get your exact zone. The most recent version of the map was released in 2023 and reflects updated temperature data collected over several decades.
Once you know your zone, you can use it as a filter every time you shop for plants. If a perennial is rated for Zones 4-9, and you live in Zone 6, you're well within range - that plant should come back year after year in your garden without extra protection.
When in Doubt, Go One Zone Colder
Reading Plant Tags and Using Zones to Choose Plants
Plant tags and seed packets list zone information in a few different ways. You might see a range like "Hardy to Zone 5" (meaning it survives Zone 5 winters and warmer), or a range like "Zones 6-10" indicating both the coldest and warmest climates where it does well.
The most useful habit is to check two things at once: the hardiness zone and the light requirement. A plant might survive your winter but still fail if it's planted in the wrong light. For a plain-English breakdown of those light terms, see what full sun, partial shade, and deep shade mean for your garden.
Microclimates and Why Your Zone Is Just a Starting Point
Your official zone is an average, and averages can mask a lot of local variation. Microclimates - small pockets of your yard with slightly different conditions - can shift your effective growing conditions by a full zone in either direction. A south-facing brick wall absorbs and radiates heat, creating a warmer microclimate ideal for slightly tender plants. A low-lying frost pocket at the back of your yard can be several degrees colder than the rest of your property on still winter nights.
Experienced gardeners learn to read these nuances and place plants accordingly. As a beginner, simply sticking to plants rated for your zone (or one zone colder) gives you a reliable safety margin while you learn your specific site. Over time, you'll notice which corners of your garden seem warmer or colder, and you can start to experiment from there.
13
Hardiness zones on the USDA map
The USDA Plant Hardiness Zone Map divides the US and its territories into 13 primary zones, each covering a 10°F range of minimum winter temperature.
2023
Year of the latest USDA zone map update
The USDA released an updated hardiness zone map in November 2023, with some regions shifting half a zone warmer based on more recent temperature records.
~50%
US counties that shifted at least half a zone
According to USDA reporting on the 2023 update, roughly half of all US counties shifted into a warmer half-zone compared to the 2012 version of the map.
Frequently Asked Questions
The content provided on our blog site traverses numerous categories, offering readers valuable and practical information. Readers can use the editorial team’s research and data to gain more insights into their topics of interest. However, they are requested not to treat the articles as conclusive. The website team cannot be held responsible for differences in data or inaccuracies found across other platforms. Please also note that the site might also miss out on various schemes and offers available that the readers may find more beneficial than the ones we cover.